
Ligandspecific activation trajectories dictate GPCR signalling in cells

Biosensor construction
Gibson assembly
All cloning, except for site-directed mutagenesis, was conducted using Gibson assembly (NEBuilder HiFi DNA Assembly Master Mix, New England Biolabs)54. All primers were synthesized by BioTeZ. A list of all of the primer sequences is provided in Supplementary Table 5. Primers 1 and 3 were used to cut within the pcDNA3.0 backbone to decrease fragment sizes and increase yields for PCR amplification. All PCR products were obtained using Q5 High-Fidelity DNA Polymerase (New England Biolabs). All constructs were verified by Sanger sequencing (LGC Genomics).
For SP-M2R-WT, the cDNA of human WT M2R was cloned into pcDNA3.0 and a cleavable signal peptide (SP)55 was cloned N-terminally of WT human M2R using primers 1 and 2, 3 and 4, and 5 and 6. To obtain SP-M2R-WT-eGFP, eGFP was fused to the C terminus of SP-M2R-WT using primers 1 and 7, 3 and 8, and 9 and 10. For the ELISA assay, an HA-tag was cloned N-terminally to the WT receptor, resulting in SP-HA-M2R-WT, using primers 3 and 11, and 1 and 12.
Site-directed mutagenesis
Receptor mutants were cloned by introducing an amber stop codon (TAG) at the desired positions by site-directed mutagenesis using the AAscan primer design tool56. A list of the primer sequences is provided in Supplementary Table 6. Mutagenesis was performed using SP-M2R-WT, SP-HA-M2R-WT and SP-M2R-WT-eGFP as templates. Point mutations were introduced by PCR using Thermo Fisher Scientific Phusion High-Fidelity DNA Polymerase (New England Biolabs). PCR products for QuickChange mutagenesis were incubated for 1 h at 37 °C with 1 µl DpnI restriction enzyme (New England Biolabs) before transformation. The resulting mutants are referred to as SP-M2RXXXTAG, SP-HA-SP-M2RXXXTAG or SP-M2RXXXTAG-eGFP throughout. To introduce the mutation disrupting the tyrosine lid closure (Y426A), the primers 13 and 14, and SP-M2R175TAG as a template were used, resulting in SP-M2R175TAG-Y426A.
The point mutation was introduced using the Q5 Site-Directed Mutagenesis Kit (New England Biolabs).
Cell culture
HEK-tsA201 (Sigma-Aldrich; referred to as HEK293T cells throughout) cells were cultured in T75 flasks at 37 °C, 5% CO2 in complete DMEM with 4.5 g l−1 glucose (PAN-Biotech). Culture media was supplemented with 10% (v/v) FBS (Biochrom), 100 U ml−1 penicillin, 100 mg ml−1 streptomycin (Biochrom) and 2 mM L-glutamine (PAN-Biotech). Cells were passaged every 2–3 days when reaching a confluency of 80–90%. For passaging and seeding, the culture medium was aspirated, cells were washed with 5 ml Dulbecco’s PBS solution (Sigma-Aldrich), detached with 2 ml trypsin/EDTA (PAN-Biotech), resuspended in 5 ml DMEM and transferred to a new T75 flask. All cell lines were routinely tested for mycoplasma contamination using MycoAlert Mycoplasma Detection Kit (Lonza Group) and were not contaminated with mycoplasma.
For the qualitative screen of labelled mutants at the accessible extracellular receptor surface, HEK293T cells were seeded on glass-bottomed 8-well µ-slides (Ibidi) at a density of approximately 7 × 10⁴ cells per well in 300 µl DMEM. For single-cell fluorescence microscopy experiments, HEK293T cells were seeded on 24 mm glass coverslips (Paul Marienfeld) in 6-well plates at a density of approximately 2.5–3 × 10⁵ cells per well in 1.5 ml culture medium. Coverslips and 8-well µ-slides were coated with poly-D-lysine (PDL; Sigma-Aldrich; 25 µg ml−1 in PBS) for 30 min at room temperature and washed with PBS twice before seeding cells. For the quantification of labelling efficiency by temporal brightness experiments, HEK-293AD (BioCat; referred to as HEK-AD cells throughout) cells were seeded on uncoated 24 mm glass coverslips in 6-well plates at a density of approximately 3 × 10⁵ cells per well in 1.5 ml culture medium.
To determine the cell-surface expression of M2R biosensors using a cell-surface enzyme-linked immunosorbent assay (ELISA), 1.6 × 10⁶ HEK293T cells were seeded into a T25 flask and grown for 24 h at 37 °C. For the TRUPATH G-protein activation experiments of WT M2 receptors, HEK293T cells were seeded into 6-well plates at a density of 3 × 10⁵ cells per well.
For the TRUPATH GαoA–activation assay of WT M2R and each of the seven M2R biosensors as well as SP-M2R175TAG-Y426A, HEK293T cells were seeded into T75 flasks and grown for 24 h at 37 °C to a confluency of 80–85%.
For the internalization experiments, HEK293T cells were seeded onto glass-bottomed 4-well µ-slides (Ibidi) at a density of approximately 5 × 10⁴ cells per well in 300 µl DMEM.
Transfection and ncAA incorporation
Principle and rationale of ncAA incorporation
To genetically encode a ncAA, an orthogonal aminoacyl-tRNA synthetase (AARS)–tRNA pair must be introduced into the host cell. This pair does not crosstalk with the endogenous synthetase–tRNA pairs responsible for incorporating canonical amino acids. Typically, the orthogonal pair is derived from a different organism—for example, bacterial pairs are commonly used for GCE in eukaryotic cells. The ncAARS specifically recognizes the ncAA, while the orthogonal tRNA functions as an amber suppressor: it carries an anticodon complementary to a stop codon (usually the amber stop codon UAG) and competes with termination factors to reassign this natural nonsense codon as a sense codon. The ncAARS charges the orthogonal tRNA with the ncAA, which is then delivered to the ribosome for regular incorporation into the nascent protein. Each ncAA requires a specific AARS, although some AARSs can accommodate more than one amino acid.
In our laboratory, we have established a two-plasmid system to incorporate ncAA into proteins of interest (POIs). One plasmid (typically pcDNA3) carries the gene encoding the POI, in which a TAG stop codon replaces the natural codon at the position targeted for ncAA incorporation. The second plasmid is a bicistronic construct that encodes the translational machinery: the aminoacyl-tRNA synthetase (AARS) and the corresponding tRNA. To ensure proper expression and processing of the procaryotic tRNA in mammalian cells, the tRNA gene—lacking the 3′-CCA sequence—is placed under the control of external Pol III promoters (H1 or U6) and followed by an appropriate trailer. To achieve the high tRNA concentrations required to outcompete the release factor, the tRNA expression cassette is typically repeated in tandem.
The orthogonal pair used for TCO*K incorporation is derived from the system that naturally incorporates pyrrolysine (Pyl) in methanogenic archaea in response to the amber codon (UAG)57. Specifically, the plasmid contains one copy of the Methanococcus barkeri pyrrolysyl-tRNA synthetase (MbPylRS) under the control of a CMV promoter, along with four tandem copies of the gene encoding the enhanced M15 tRNA for expression in mammalian cells58. The plasmid, which was generated in our lab, is deposited in Addgene, where the complete map and additional information can be found (105830, https://www.addgene.org/105830/).
Protocols
Live-cell epifluorescence microscopy
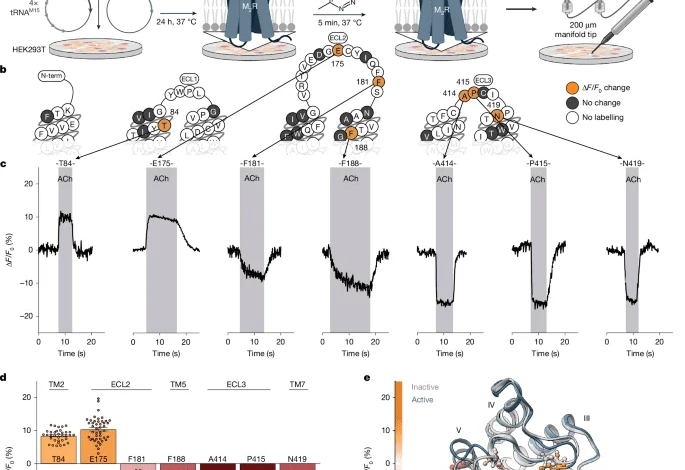
Cells grown on coverslips in 6-well plates were transfected 12–24 h after seeding when reaching a confluency of 40–60%. Before transfection, the culture medium was changed to DMEM without supplemented antibiotics, FBS and L-glutamine. For bioorthogonal labelling of trans-cyclooct-4-en-lysine (TCO*K, SiChem) a premix of HEPES buffer (1 M, pH 7.4, Sigma-Aldrich) and TCO*K stock solution (100 mM TCO*K in ncAA storage buffer, 0.2 M NaOH, 15% DMSO) was added to a final concentration of 0.25 mM TCO*K per well 1 h before transfection. Cells on coverslips were transfected using Lipofectamine 2000 transfection reagent (Thermo Fisher Scientific) as follows: per well a total amount of 1.5 µg cDNA was diluted with 150 µl Opti-MEM (Thermo Fisher Scientific) and combined after 5 min incubation at room temperature with 3.75 µl Lipofectamine 2000 transfection reagent, diluted in 150 µl Opti-MEM. After 20 min incubation at room temperature, the transfection mixture was added dropwise to each well.
To maintain cell viability and to remove remaining excess TCO*K, the medium was changed to complete DMEM 4–6 h after transfection. Cells were grown an additional 18–20 h before single-cell microscopy experiments were conducted.
For ncAA incorporation and subsequent bioorthogonal labelling, the cDNA of SP-M2RXXXTAG or SP-M2R175TAG-Y426A (for biosensor activation experiments) or SP-M2RXXXTAG-eGFP (for expression analysis and quantification of bioorthogonal labelling) and the MbPylRSAF/4xtRNAM15 were transfected at a 1:1 ratio. For the labelled control without ncAA incorporation, cells were transfected with SP-M2R414TAG/MbPylRSAF/4xtRNAM15 as described in the previous section (total amount of cDNA, 1.5 µg) but then not loaded with TCO*K. When overexpressing the GαoA(G203T) mutant, a cDNA ratio (total amount of cDNA, 1.5 µg) of 1:1:1 (SP-M2RXXXTAG:GαoA(G203T):MbPylRSAF/4xtRNAM15) was used. For the Gαi3-FRET activation assay, the cDNA (total amount of cDNA, 1.5 µg) of the SP-M2RXXXTAG or SP-M2R-WT was transiently transfected with MbPylRSAF/4xtRNAM15 and the Gi3-FRET biosensor at a ratio of 10:10:1.
For the internalization experiments, the cDNA (total amount of cDNA, 1.5 µg) of SP-M2RXXXTAG or SP-M2R-WT-eGFP, MbPylRSAF/4xtRNAM15 and GRK3 were transfected at a 5:5:1 ratio.
Cell-surface ELISA
For determining the cell-surface expression of M2R biosensors using ELISA, the cells were supplemented with TCO*K as described above and transfected with 10 µl Lipofectamine 2000, using a cDNA ratio of 1:1 (SP-HA-M2RXXXTAG or SP-HA-M2R-WT, MbPylRSAF/4xtRNAM15) of 4 µg total plasmid 24 h after seeding in a T25 cell culture flask.
BRET-based G-protein activation experiments (TRUPATH)
To assess the G protein-activation profile of M2 WT receptors, cells were transfected with SP-M2R-WT, Gα-RLuc8, Gβ and GFP2-Gγ at a ratio of 1:1:1:1 in a total amount of 1.5 µg cDNA per well of a 6-well plate. For each Gα subunit, the combination of Gβ and Gγ used was the one optimized previously53, as listed in Supplementary Table 7. Transfection was performed using the Effectene Transfection Kit (Qiagen) 18–24 h after seeding. For the transfection per well, the cDNA was premixed with 66 µl DNA-condensation buffer (EC-buffer) and 12 µl enhancer was added, mixed and incubated at room temperature for 2 min. After adding 6 µl Effectene, the mix was incubated at room temperature for 20 min. The culture medium was renewed, 350 µl DMEM was added to the transfection mix and the resulting solution applied dropwise to the cells.
For TRUPATH GαoA-activation experiments of M2R WT and each of the seven M2R biosensors as well as the double mutant SP-M2R175TAG-Y426A, per T75 flask cells were transfected with the cDNA of either SP-M2R-WT (1.5 µg) or SP-M2RXXXTAG (3.5 µg) together with MbPylRSAF/4xtRNAM15 (3.5 µg), GαoA-RLuc8 (1.5 µg), Gβ8 (1.5 µg) and GFP2-Gγ3 (1.5 µg). In the case of SP-M2R-WT the amount of cDNA was lowered to reduce expected expression differences compared with the M2R biosensors. To ensure equal levels of transfected cDNA among all samples, 2 µg of empty pcDNA3.1 vector was added to the samples containing SP-M2R-WT. Transfections were performed using Lipofectamine 2000 transfection reagent according to manufacturer recommendations for 16–24 h.
In brief, cDNAs were dissolved in 1,200 µl OptiMEM (per flask), incubated for 5 min and 1,200 µl of OptiMEM containing 30 µl of Lipofectamine was added per transfection mixture and incubated with the cDNAs for 20 min at room temperature. The resulting solution was then added into freshly exchanged DMEM containing 100 mM TCO*K, according to the same principle as described above. To avoid transfection variability in between the different M2Rs, stock solutions containing MbPylRSAF/4xtRNAM15, GαoA-RLuc8, Gβ8 and GFP2-Gγ3 with appropriate cDNAs quantities, as well as Lipofectamine were prepared and divided subsequently for each construct.
Bioorthogonal labelling of M2R biosensors
Fluorescent labels were attached to the receptor using ultra-rapid click chemistry between dye–tetrazine derivatives and the ncAA TCO*K. While we have experience with other labelling chemistries13 in our laboratory, such as copper-catalysed azide–alkyne cycloaddition (CuAAC) on both azide- and alkyne-containing ncAAs, and strain-promoted azide–alkyne cycloaddition (SPAAC) on ncAAs bearing strained alkynes (for example, BCNK)14, we have consistently achieved the best results in terms of labelling speed, efficiency, cell viability and reproducibility using ultrarapid strain-promoted inverse electron-demand Diels–Alder cycloaddition on TCO*K. This ncAA carries a selected isomer of cyclooctene (trans-2-cyclooctene), which is highly reactive with both tetrazine and methyl-tetrazine dye derivatives yet sufficiently stable over the duration of the experiment (maximum of 2 min)41.
Cells expressing SP-M2RXXXTAG or SP-M2RXXXTAG-eGFP, as well as SP-M2R175TAG-Y426A, were labelled 30 min to 1 h before microscopy. If not indicated otherwise, cells were labelled with Tet–Cy3-conjugated dye (JenaBioscience) according to our previously published protocol59. In brief, Tet-conjugated dyes were dissolved in imaging buffer (144 mM NaCl, 5.4 mM KCl, 1 mM MgCl2, 2 mM CaCl2, 10 mM HEPES, pH 7.3), from 0.5 mM stock solutions in DMSO to a final concentration of 1.5 µM. The culture medium was removed from the cells and, subsequently, 0.5 ml (coverslips) or 150 µl (µ-slides) of the solution was applied to the cells and removed after 5 min incubation at 37 °C. Cells were kept in imaging buffer at 37 °C until imaging. For the Gi3-FRET activation assay cells were labelled using Tet-Cy5-conjugated dye (Lumiprobe) according to the same protocol.
Cells were labelled with Cy5 (instead of Cy3) to overcome the spectral overlap of Cy3 with the acceptor fluorophore of the Gi3-FRET biosensor (that is, cpVenus). To test the transferability of the biosensor approach using structurally different dyes, cells were labelled with tetrazine-5-TAMRA (JenaBioscience) using the same protocol.
Labelling screen of M2R mutants
For these experiments, the SP-M2RXXXTAG-eGFP constructs were used. For the qualitative evaluation of full-length receptor expression and membrane localization, all cloned constructs of SP-M2RXXXTAG-eGFP were expressed in HEK293T cells and labelled at the respective site as described before. Confocal images of the cells expressing SP-M2RXXXTAG were taken before and after labelling with Tet–Cy3 to ensure cell viability before labelling. The screen for labelled receptor mutants was done using a LEICA TCS SP8 laser-scanning microscope with an oil-immersion objective (HC PL APO ×63/1.40 NA, oil). A 554 nm laser was used at 5% power to excite Cy3 fluorophores and the respective emission was measured within 590–650 nm. To excite eGFP fluorophores, a 488 nm laser was used at 5% power and the respective emission was measured within 500–555 nm.
Images were acquired with a hybrid detector in sequential scan mode to avoid bleedthrough (1,024 × 1,024 pixel, line average 4, 400 Hz, gating 0.3–6 ms) using the Leica Application Suite X (LASX) software (v.3.5.7.23225). Labelling was assessed by considering full-length receptor expression (reflected by C-terminal eGFP) and Cy3-staining of the same cells. M2R mutants were evaluated as being labelled when Cy3-labelling and eGFP membrane staining could be observed robustly for cells from at least three independent experiments.
Temporal brightness analyses through quantification of labelling efficiencies
For these experiments, the SP-M2RXXXTAG-eGFP constructs were used. The labelling efficiency of the selected M2R biosensors was quantified using molecular brightness analyses according to a previously published protocol59. In brief, the seven different SP-M2RXXXTAG-eGFP constructs were transfected in HEK-AD cells and bioorthogonally labelled with Tet–Cy3 as described in the ‘Bioorthogonal labelling of M2R biosensors’ section above. Temporal brightness experiments were conducted on the LEICA TCS SP8 laser-scanning microscope, using the same laser lines and detector settings as described in the ‘Labelling screen of M2R mutants’ section above. To reduce possible photobleaching, the laser power was reduced to 1% while identifying appropriate cells. Cells were imaged at their basolateral membranes. Suitable cells for the analysis exhibited a homogenous morphology of the basolateral membrane and distribution of fluorescent spots. For each cell, 100 consecutive frames were acquired (256 × 256 pixel, line average 1, zoom factor 22.8).
Temporal brightness analysis was performed in ImageJ (v.1.5.4f) using the Number & Brightness analysis plugin of J. Unruh60. Image stack files were converted to 16-bit and appropriate regions with homogenous intensity distribution were selected from single fluorescence channels, opened as interactive 2D histogram. The number of emitters per pixel was extracted from the intensity of that pixel divided by the molecular brightness of the emitters as follows:
N = xavg / yavg − 1, where yavg represents the average apparent brightness of all selected pixels over time and xavg represents the average intensity of all selected pixels over time. The data were plotted as a scatter dot plot of N obtained from the eGFP channel and N obtained from the Cy3 channel. To determine the labelling efficiency, data were fitted to a linear regression with constraints at x,y = 0. The slope of the regression indicates the resulting labelling efficiency.
Live-cell epifluorescence microscopy
Single-cell kinetic experiments with M2R biosensors
For these experiments, the SP-M2RXXXTAG constructs, as well as SP-M2R175TAG-Y426A, were used. Kinetic single-cell fluorescence microscopy experiments using the M2R biosensors were conducted using an inverted DMi8 epifluorescence microscope (Leica Microsystems), equipped with an oil-immersion objective (HC PL APO ×63/1.40–0.60, oil), a high-speed polychromator (VisiChrome, Visitron Systems), a Xenon-Lamp (75 W, 5.7 A, Hamamatsu Photonics) or a CoolLED pE-800 (40% illumination, CoolLED) for the labelled control without ncAA incorporation and the kinetic experiments with the SP-M2R175TAG-Y426A mutant, a Photometrics Prime 95B sCMOS camera (Visitron Systems) with a Optosplit II dual emission image splitter (Cairn research), and the Visiview v.4.0 imaging software (Visitron Systems). A DAPI/FITC/Cy3/Cy5 ET Quadband Filter (ChromaTechnology) was used for imaging Cy3-labelled cells at 555/10 nm. Emission was recorded using a T590lpxr dichroic mirror (ChromaTechnology) and a 595/50 nm emission filter (ChromaTechnology).
Coverslips with transfected cells were transferred to imaging chambers (Attofluor, Thermo Fisher Scientific) and washed once with imaging buffer. Cells were kept in imaging buffer throughout the experiment. All single-cell imaging was performed at room temperature. For ligand application, a solenoid valve perfusion system with a 200-µm inner diameter manifold-tip (Octaflow II, ALA Scientific Instruments) was used. Ligands were applied in direct vicinity of the cells after superfusion with imaging buffer for 5–10 s. The superfusion was conducted at a pressure of 50 mbar. Image sequences were recorded at 100-ms excitation time and acquisition intervals or 50 ms when using the CoolLED pE-800 lightsource. Image processing was performed with ImageJ61. Each cell was analysed individually. Cell membranes were selected as regions of interest using the drawing tool. An area without cells was defined as background. Fluorescence intensity over time of all regions was extracted for each emission channel.
The raw data were processed by subtracting the background fluorescence at every timepoint for all recorded emission channels.
Changes in the fluorescence emission intensity were normalized to baseline according to the following formula: ΔF/F0 = ((F − F0)/F0) × 100%, where F0 is the mean emission intensity of the first ten datapoints of the time series, and F is the mean emission intensity of ten datapoints at the stable plateau of emission intensity changes reached after ligand application. To retrieve the apparent on-rates τ, a plateau followed by one-phase association/decay ordinary fitting was performed as follows: r(t) = F0 + (Plateau-F0) × ((1-{e}^{-Ktimes (t-{t}_{0})})), if t < t0, where t is time (s), t0 is the respective timepoint of ligand application and Plateau-F0 is the amplitude of emission intensity change. From this, τ has been calculated as τ = 1/K. Concentration–response curves were fit using a four-parametric variable slope fit (log(agonist) versus response) by calculating:
Y = Bottom + (Top − Bottom)/((1+{10}^{log ({rm{E}}{{rm{C}}}_{50}-X)}times {rm{H}}{rm{i}}{rm{l}}{rm{l}}{rm{S}}{rm{l}}{rm{o}}{rm{p}}{rm{e}})), where X is the log of dose or concentration, Y is the response (Plateau) and Top is the maximum efficacy Emax.
Gi3-FRET activation assay
For the Gi3-FRET activation assay, the SP-M2RXXXTAG constructs were used. The FRET assay was performed using an Olympus IX83 Inverted Microscope equipped with an oil-immersion objective (UPLAPO60XOHR ×60/1.5 NA, oil) with an ORCA-Fusion C14440-20UP camera (Hamamatsu Photonics). A Spectra III-LCR-8S-A21 light engine (Lumencore) at 50 mW light intensity and an additional 20% transmission neutral-density filter (Qioptiq Photonics) were used for excitation with the following band-pass filters: CFP, 438/29 nm; YFP, 511/16 nm; Cy5 637/12 nm. The emission light was split into two channels using an OPTOSPLIT II (Cairn research) equipped with the following band-pass filters: CFP, 475/28 nm; YFP, 542/27 nm; and Cy5, 700/75 nm. For FRET measurements only Tet–Cy5-labelled cells were imaged. Sequences of images were acquired with camera scan mode 2, a 30 ms excitation time, 100 ms frame interval and 2 × 2 camera binning, resulting in 1,152 × 1,152 pixel resolution.
After each individual FRET-experiment, YFP direct excitation was recorded with the same imaging settings, enabling comparisons of sensor expression. Ligands were applied using a solenoid valve perfusion system with a 100-µm inner diameter manifold-tip (Octaflow II, ALA Scientific Instruments) at a pressure of 350 mbar. In addition to background correction for both donor and acceptor emission, the obtained acceptor emission was corrected for spectral bleedthrough (B) as Acceptoremission − B × Donoremission (ref. 62). The spectral bleedthrough was experimentally determined from FRET measurements of HEK293T cells expressing the donor fluorophore mTurquoise2 as the ratios of acceptor/donor emission. A correction factor of 0.22 was determined from three independent experiments. The FRET-ratios were calculated as the ratio of corrected acceptor emission (referred to as FRET) over corrected donor emission as Acceptoremission/Donoremission.
All datapoints were plotted as ΔFRET (%) = (FRET − FRET0/FRET0) × 100%, where FRET0 is the baseline, which was determined from the average of ten datapoints before ligand application.
Inhibition of endogenous Gi/o proteins with PTX
For these experiments, the SP-M2RXXXTAG constructs were used. To inhibit the activation of endogenous Gi/o proteins, cells have been treated overnight with the exotoxin PTX (Tocris Bioscience). To this end, HEK293T cells were seeded and the M2R biosensors were transfected as described above. After 4–6 h of transfection, the culture medium was exchanged for complete DMEM, and PTX was added to the cells at a final concentration of 0.1 µg µl−1. Cells were grown an additional 18–20 h before single-cell microscopy experiments were conducted. Labelling, fluorescence microscopy and image processing were carried out as described above. For suitable comparability, single-cell microscopy experiments were conducted for cells with and without PTX pretreatment on the same day for the same M2R biosensor.
Cell-surface expression of M2R biosensors
For these experiments, the SP-HA-M2RXXXTAG and SP-HA-M2R-WT constructs were used. Cell-surface expression of SP-M2R-WT and the M2R biosensors in HEK293T cells was assessed using an indirect cellular ELISA assay as described in a previously published protocol63. In brief, 24 h after transfection, cells were detached using Versene, reseeded into 48-well plates at a density of 1.2 × 10⁵ cells per well and grown at 37 °C for another 24 h. The ELISA assay was performed by fixing the cells with 4% formaldehyde, washing twice with PBS, blocking with DMEM supplemented with 10% FBS. The medium was removed and 50 mU ml−1 anti-HA-peroxidase antibody (1:1,000, Sigma-Aldrich) was applied to the cells. The cells were washed three times with PBS. Subsequently, PBS was removed and detection solution (3.7 mM o-phenylenediamine, 22.65 mM citric acid, 51.4 mM Na2HPO4) including H2O2 were applied.
The reaction was stopped by adding stopping reagent (0.12 M Na2SO3, 1 M HCl). Per well, the supernatant was transferred into a clear 96-well plate and the absorbance was measured at 492 nm (620 nm reference wavelength) in an EnVision microplate reader. The data were corrected to the reference wavelength and normalized to the absorbance of M2R WT (set to 100%).
BRET-based G protein-activation experiments (TRUPATH)
G-protein-activation profile of the M2R WT
To survey which G proteins are activated by the SP-M2R-WT, we used the TRUPATH library (Addgene, 1000000163) according to protocols that were published recently53,64. In brief, 24 h after transfection cells were detached, collected in fresh supplemented DMEM and reseeded into PDL-coated white 96-well plates at a density of 5 × 10⁴ cells per well. Cells were grown at 37 °C for another 24 h. The plates were stored at room temperature for 10 min before starting the assay. The culture medium was removed, and the cells in every well were washed twice with imaging buffer. Cells were kept in 60 µl imaging buffer and 10 µl of freshly prepared Prolume Purple working solution (NanoLight Technology) was added to each well at a final concentration of 5 µM per well. The plates were incubated for 5 min at room temperature in the dark.
BRET measurements were performed using the Synergy Neo2 plate reader (Agilent Technologies), equipped with the BRET2 Filter cube (Agilent Technologies, 400/510 nm emission) and using a 50 ms integration time. Before ligand application of 30 µl per well, a baseline was recorded for 5 min. Negative controls were obtained by the addition of 30 µl imaging buffer per well instead of ligand. The BRET measurement was continued for 20 min with a time interval of 45 s between each datapoint. The BRET ratios 510/400 of each well were normalized to the baseline of the negative control (set to 100%). For the G-protein-activation heat map, all datapoints were normalized to the mean plateau value of the wells stimulated with 1 mM ACh. The data were analysed using Microsoft Excel 2016.
Functional characterization of M2R biosensors
For the TRUPATH GαoA-activation assay of WT M2R and the seven M2R biosensors, the same batch of cells expressing one of the M2R biosensors or the WT receptor was seeded into the same plate, and all of the ligands were tested within the same read. BRET measurements were performed using a PHERAstar fsx plate reader (BMG Labtech), equipped with a BRET2 filter cube (BMG Labtech, 410/530 nm emission). The baseline was recorded for 5 min followed by 7 min stimulation with the different ligands with a time interval of 60 s between each datapoint. The inverse BRET ratios 410/530 of each well were normalized to the baseline of negative control (set 0%) and ACh maximum concentration (set 100%) for each mutant. The data were analysed using Microsoft Excel 2016.
Internalization assay
The SP-M2R-WT-eGFP and the SP-M2RXXXTAG constructs were expressed in HEK293T cells and labelled with Tet–Cy3 as described in the previous sections. After addition of ACh (400 µM), cells were incubated for 1 h at 37 °C. Images were acquired using the Axio Observer.Z1/7 microscope (Zeiss), equipped with a C-Apochromat ×63/1.2 NA W Korr DICII objective, an AxioCam 705 mono with Duolink camera and a LED Colibri 5 light source. Filters used (bandpass/bandstop in nm): eGFP, 450–490/495 (excitation), and 500/550 nm (emission); Cy3, 545–565/575 (excitation) and 579–604 nm (emission). Images were acquired using Zen blue 2.3 lite software (Zeiss).
Data analysis and statistics
Plotting, curve fitting and statistical analyses were performed using Prism v.7.0 or newer (GraphPad). Drift corrections in fluorescence imaging was performed using Origin 2022 (OriginLab). A Gaussian distribution of all datapoints was tested using the D’Agostino–Pearson omnibus normality test in Prism 7.0.
Statistic differences of two groups were assessed using two-tailed unpaired Student’s t-tests. A two-tailed paired t-test was performed when comparing various data obtained from the same single cell. In the case of normal distribution, a parametric test was used. Welch’s correction was further performed in the case of unequal variance. Statistic differences of three or more populations have been assessed using a parametric one-way ANOVA. When comparing to a reference group of data, a Tukey’s post hoc test was performed. In the case of multiple comparisons, a Dunnett’s test was used. For all statistical analyses, the confidence interval was set to 95% (P = 0.05). All experiments were performed with samples from independent experiments and repeated at least three times. The number of individually analysed cells is referred to as n.
Details about n and the statistical test performed are stated in the appropriate figure legend.
Molecular models of receptors and analyses thereof were performed with UCSF ChimeraX, developed by the Resource for Biocomputing, Visualization, and Informatics at the University of California, San Francisco, with support from National Institutes of Health R01-GM129325 and the Office of Cyber Infrastructure and Computational Biology, National Institute of Allergy and Infectious Diseases65. Schematics were created using BioRender.
For Fig. 2, the ΔF/F0 of each condition was normalized to the ΔF/F0 obtained for ACh within the same cell. For Fig. 3c,f,i and Supplementary Fig. 5, data from overexpression of the GαoA(G203T) mutant were normalized to data obtained at endogenous G-protein levels using the following equation: Norm ΔΔGmut = ((Gmut − meanendo)/meanendo) × 100%, where Gmut represents the ΔF/F0 of the respective M2R biosensor when co-expressed with GαoA(G203T), and meanendo refers to the mean ΔF/F0 at endogenous G-protein levels (Fig. 2 and Supplementary Table 1). For Supplementary Fig. 6, the ΔF/F0 of each datapoint obtained from activation of the seven M2R biosensors with the ligands Ixo, Arec and Pilo was normalized to the mean ΔF/F0 of ACh at endogenous G-protein expression levels or after overexpression of GαoA(G203T).
For Fig. 4, three-dimensional surface plots (Fig. 4) were generated using the NumPy and matplotlib libraries of Python (v.3.7.9)66,67. The plots were generated as abstract Gaussian peaks modelled using the Gaussian function: (z(x,y)=Atimes {e}^{(-((x-{x}_{0})2+(y-{y}_{0})2)/2sigma 2)}) with A as the mean ΔF/F0 relative to the plane z = 0. M2R biosensors indicating the same receptor–G-protein complex were assigned similar colours. For each ligand-dependent receptor/G-protein complex at a given timepoint after agonist activation, the colour intensities from all positions were summed, and the respective plane was labelled in that colour.
Reporting summary
Further information on research design is available in the Nature Portfolio Reporting Summary linked to this article.
تنويه من موقعنا
تم جلب هذا المحتوى بشكل آلي من المصدر:
yalebnan.org
بتاريخ: 2026-01-15 08:52:00.
الآراء والمعلومات الواردة في هذا المقال لا تعبر بالضرورة عن رأي موقعنا والمسؤولية الكاملة تقع على عاتق المصدر الأصلي.
ملاحظة: قد يتم استخدام الترجمة الآلية في بعض الأحيان لتوفير هذا المحتوى.